How Georgia Turned Blue
And why it might not stay that way.
In 2008, Barack Obama won about 47 percent of the vote in Georgia, a huge improvement for the Democrats from four years earlier, when John Kerry received just 41 percent in the state. And with the Atlanta metro area booming in population, it seemed like a state that hadn’t voted for a Democratic presidential candidate since 1992 was about to turn blue — or at least purple. But it didn’t. Instead, Georgia was stuck in swing-state-in-waiting status. Obama dipped to 45 percent in 2012 — and Democrats seemed capped at exactly that number. The party’s candidates for U.S. Senate and governor in 2014 won 45 percent of the Georgia vote, as did Hillary Clinton in 2016.
That is, until 2018, when Stacey Abrams broke through the 46 percent ceiling and hit 48.8 percent in her gubernatorial campaign. And this year, of course, Joe Biden won the state with 49.5 percent of the vote. Meanwhile, U.S. Senate candidate Jon Ossoff got 48.0 percent, and is now headed to a runoff election. Georgia’s special election for its other U.S. Senate seat is also headed to a runoff, with the combined total for the Democratic candidates at 48.4 percent.
So how did Georgia go from light red to blue — or at the very least, purple?
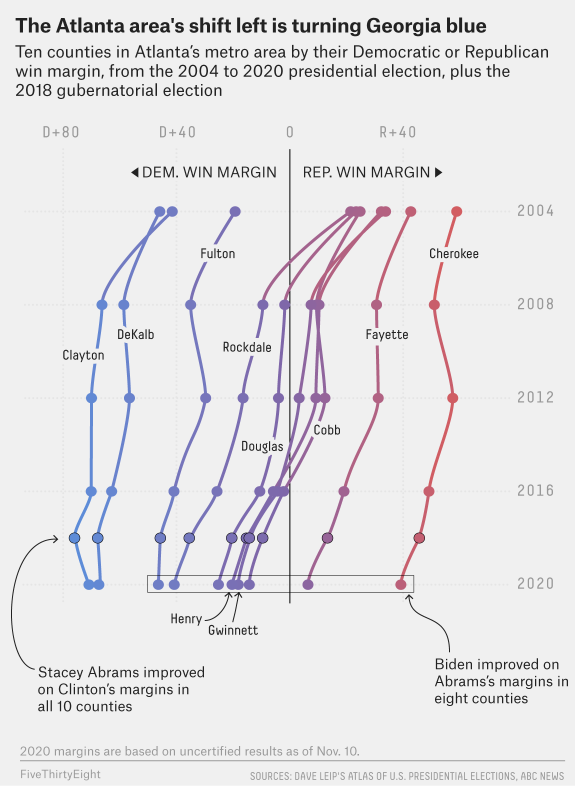
The answer is pretty simple: The Atlanta area turned really blue in the Trump era. Definitions differ about the exact parameters of the Atlanta metropolitan area, but 10 counties1 are part of a governing collaborative called the Atlanta Regional Commission. Almost 4.7 million people live in those 10 counties, or around 45 percent of the state’s population.
Until very recently, the Atlanta area wasn’t a liberal bastion. There was a Democratic bloc that long controlled the government within the city limits of Atlanta and a Republican bloc that once dominated the suburbs and whose rise was chronicled in historian Kevin Kruse’s 2005 book “White Flight: Atlanta and the Making of Modern Conservatism.”
In 2012, Obama and Republican presidential nominee Mitt Romney each won five of the 10 counties in the Atlanta Regional Commission. But in 2016, Clinton won eight of the 10 counties. In 2018, Abrams won those eight counties by larger margins than Clinton, and Biden then improved on Abrams’s margins in most of them.2 For example, Romney carried Gwinnett — an Atlanta-area suburban county that is the second-largest county in the state — by 9 percentage points in 2012. But then Clinton won there by 6 points in 2016, Abrams won by 14 points in 2018, and this year, Ossoff won by 16 and Biden won by 18. Likewise, in Cobb County, another large Atlanta-area suburban county, Romney won by 12 points in 2012, but then Clinton carried it by 2, Abrams by 10, Ossoff by 11 and Biden by 14. (We’ll come back to Biden doing slightly better than Ossoff and what that might mean for the runoffs.)

Those are big gains in big counties. And there are other indications that suburban Atlanta is trending blue. Parts of Cobb County are in the district of Rep. Lucy McBath, who in 2018 flipped a U.S. House seat that the GOP had held for decades. (She won reelection this year, too.) Meanwhile, Democrat Carolyn Bourdeaux flipped a U.S. House seat that includes parts of Gwinnett County, one of only a handful of seats that Democrats won control of this year. Republican sheriff candidates in Cobb and Gwinnett counties were both defeated in this November’s election. And Gwinnett’s five-person county commission is now made up of five Democrats, after Democrats flipped three seats on the commission this year.
Cobb and Gwinnett are not suburbs in the coded way the political media often invokes them as a synonym for “areas slightly outside of the city limits of major cities where lots of middle-class white people live.” Gwinnett County is 35 percent non-Hispanic white, 30 percent Black, 22 percent Hispanic and 13 percent Asian. Cobb County is 51 percent non-Hispanic white, 29 percent Black, 13 percent Hispanic and 6 percent Asian.
Democrats have also made gains in the more urban DeKalb and Fulton counties, which both include parts of the city of Atlanta and were already pretty Democratic leaning. In Fulton, which is about 45 percent Black and Georgia’s most populous county, Obama won in 2012 by 30 points, Clinton by 41, Abrams by 46, Ossoff by 42 and Biden by 46. In DeKalb, which is 55 percent Black and the state’s fourth-largest county, Obama won by 57 points, Clinton by 63, Abrams by 68, Ossoff by 64 and Biden by 67.
There is a third shift happening, too: Democrats are losing by less in the more conservative-leaning, exurban parts of Atlanta. In Cherokee County, Georgia’s seventh-largest county and one that is nearly 80 percent white, Obama lost by 58 points, Clinton by 49, Abrams by 46 and Biden by 39.
“Exurbs are where a big chunk of the GOP base is. And you can’t win Georgia [as a Republican] without running up the margins there,” Atlanta Journal-Constitution political reporter Greg Bluestein told me.
We should emphasize, though, that there are limits in how precise we can be in describing these shifts. Trump did better than in 2016 in some heavily Black Atlanta precincts (while still losing them overwhelmingly), according to a New York Times analysis. So it could be the case that many of Biden’s gains are among non-Black Atlanta-area voters, although it’s important to emphasize that many Black people in the Atlanta area live in racially mixed areas. County and precinct analyses have some limitations, and more detailed research will help us nail down exact shifts among demographic groups.


